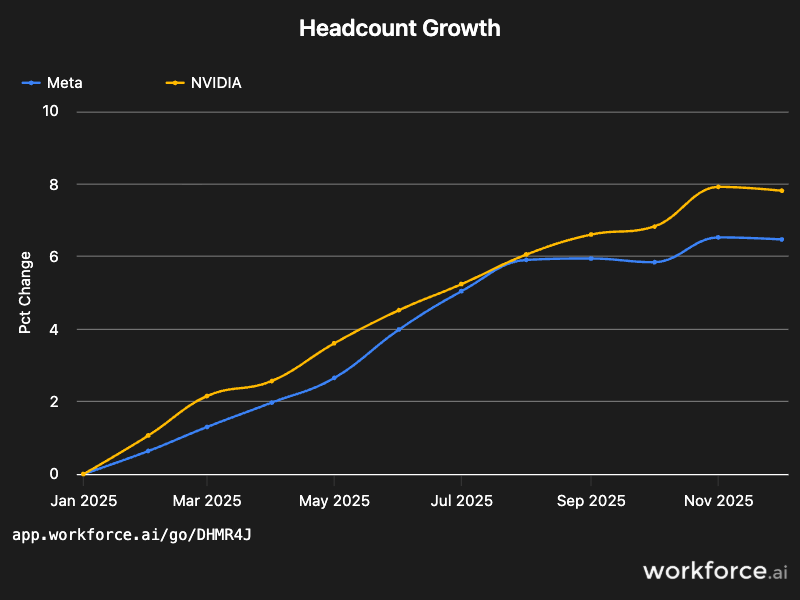
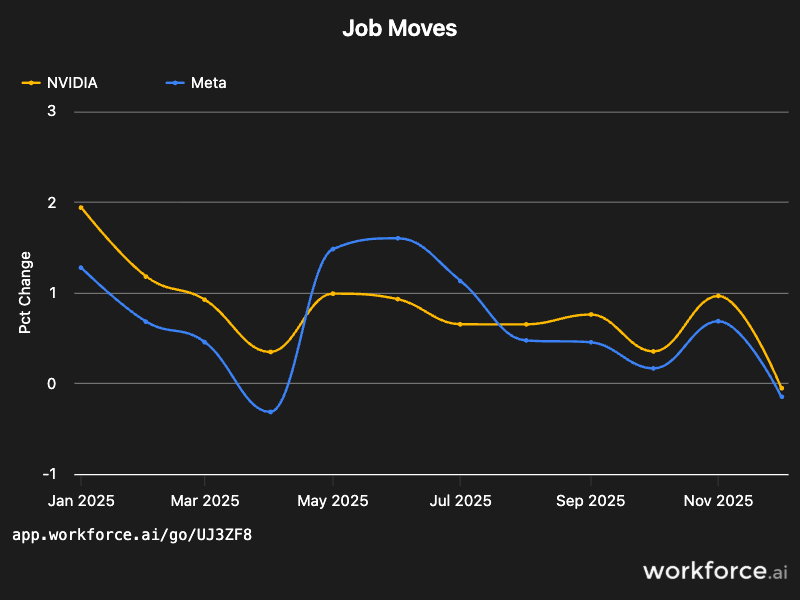
Meta vs. NVIDIA Workforce Metrics 2025
A head-to-head comparison of headcount growth, job functions, employee movement, and talent flow between Meta and NVIDIA.

A head-to-head comparison of headcount growth, job functions, employee movement, and talent flow between Meta and NVIDIA.


.svg)

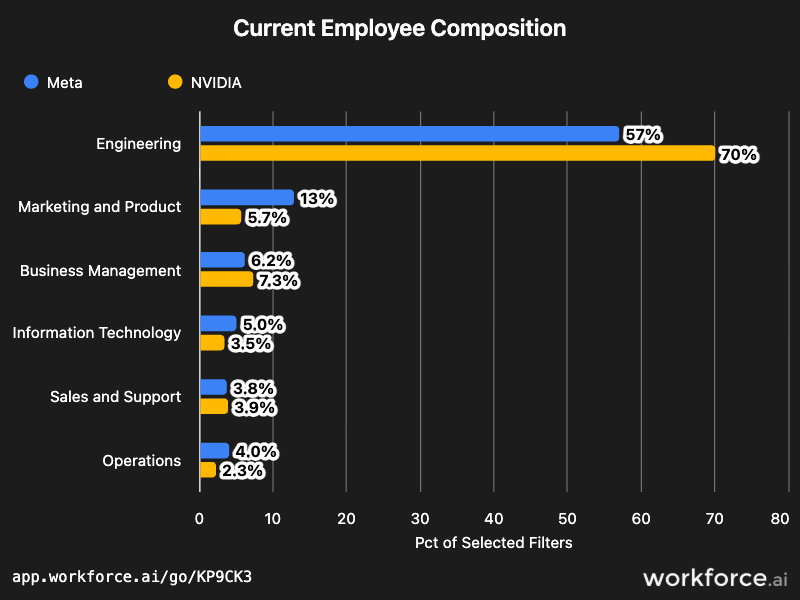
Easily compare the current workforce makeup of Meta and NVIDIA by job function, showing how each company allocates talent across engineering, product, business, IT, sales, and operations.
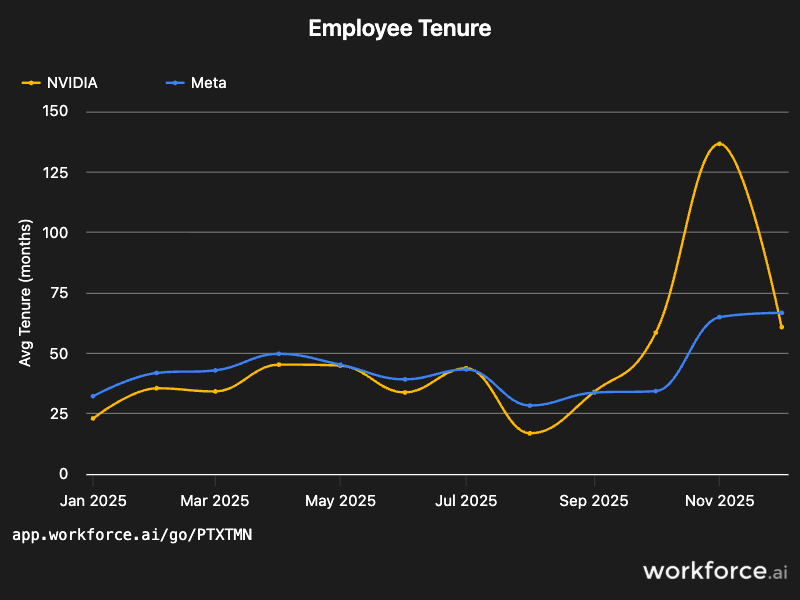
See how employee tenure has changed over time at Meta and NVIDIA, highlighting shifts in workforce stability, retention, and churn. By tracking average tenure month over month, you can see when each company experienced longer employee stays versus periods of increased turnover.
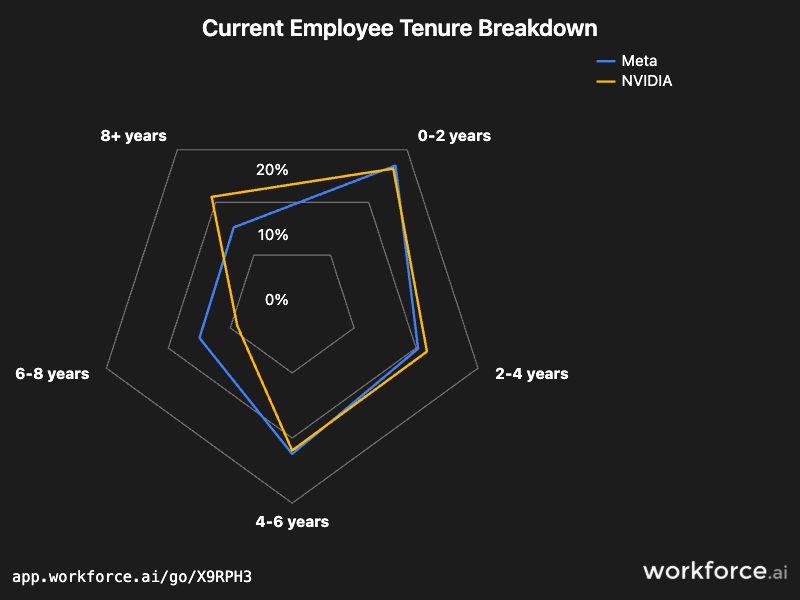
Explore how a Meta and NVIDIA’s workforce is distributed by employee tenure, from recent hires to long-tenured employees, providing insight into retention patterns, seniority mix, and overall workforce stability.
Live Data Labs
To let 1M data apps bloom, we’re constantly building on top of our API.


